What Facebook ad metrics actually matter?
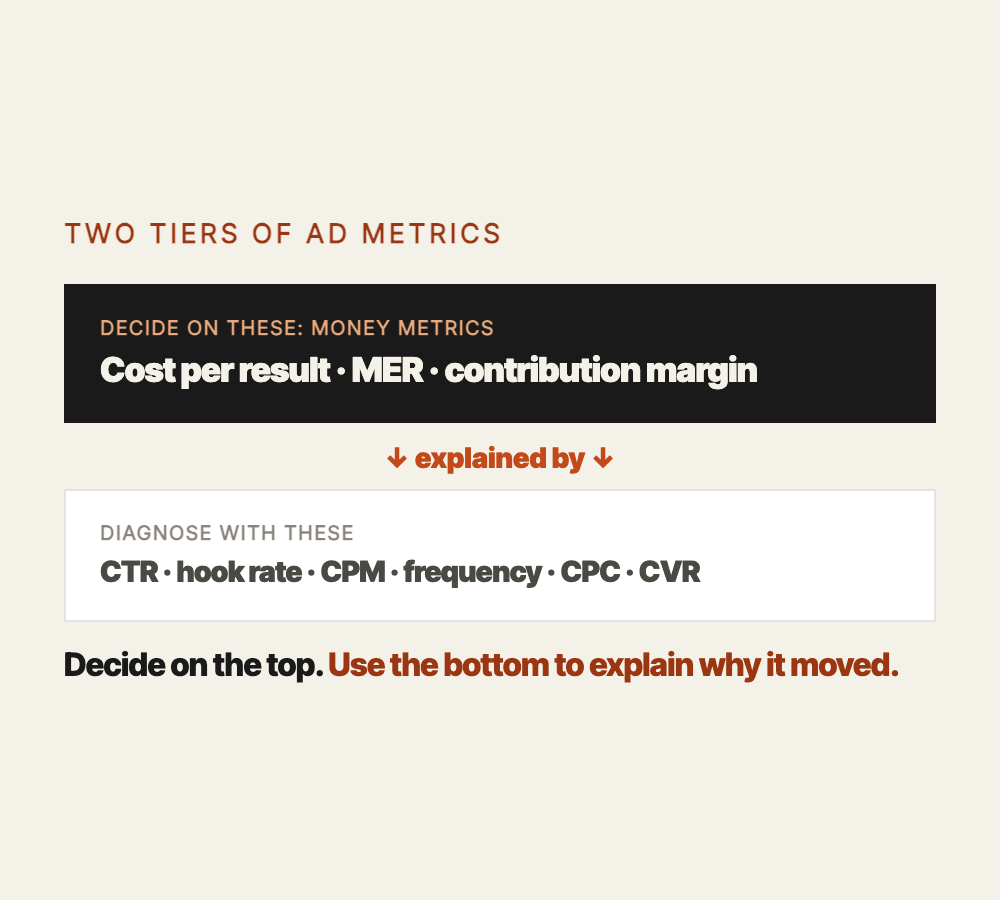
Two Facebook ad metrics decide whether a campaign is working: cost per result and MER (marketing efficiency ratio, your total revenue divided by your total ad spend). Everything else on the dashboard, click-through rate (CTR), cost per 1,000 impressions (CPM), hook rate, frequency, is diagnostic. Diagnostic metrics explain why cost per result moved. They do not tell you whether to keep spending. Most media buyers get this backwards, staring at CTR or CPM as if a good number there means the campaign is healthy, when a campaign can have a great CTR and still lose money on every order.
- Money metrics (decide on these): cost per result, MER, contribution margin.
- Diagnostic metrics (explain why the money moved): CTR, CPM, hook rate, frequency, cost per click (CPC).
- Hook rate and hold rate are not official Meta metrics. They're practitioner ratios built on Meta's raw video-view columns; different tools calculate them differently.
- Platform ROAS (return on ad spend) can overstate results, because the same sale can be claimed by more than one platform. MER cannot be inflated that way.
- There is no universal "good" benchmark number. A good ROAS or MER depends on your margin, your average order value (AOV), and your model. Benchmark against your own break-even.
What's the difference between "diagnostic" and "money" metrics?
Think of your ad account as a two-tier stack. The top tier is what you decide on. The bottom tier is what you check when the top tier moves.
Money metrics sit on top: cost per result (what one purchase or lead actually cost) and MER (total revenue divided by total ad spend, across every channel). These are the only two numbers that answer "should I keep spending."
Diagnostic metrics sit underneath: CTR, CPM, hook rate, frequency, CPC, conversion rate (CVR). None of these tell you whether the campaign made money. They tell you why cost per result changed. A campaign with a strong CTR and a rising cost per result is not a win, it's a diagnosis in progress.
What do CPM, CTR, and CPC actually tell you?
CPM is your spend divided by impressions, times 1,000. It's the base price of reach, set by a live auction, not a fixed rate. More advertisers competing for the same audience raises it.
CTR (link click-through rate) is link clicks divided by impressions. It tells you how compelling the hook is at earning a click, nothing more.
CPC is your spend divided by link clicks, the price of one click to your destination. All three are official Meta fields, and all three are diagnostic. They describe the funnel's top half, not whether the sale was profitable.
The money metrics and the triage order are below
Why is cost per result the number that should decide anything?
Cost per result is your spend divided by results (Meta labels the field "Cost per Result"; in direct response it's often called cost per acquisition, or CPA). It answers one question directly: what did one purchase or lead actually cost.
This is a money metric because it connects straight to your break-even. If your break-even cost per result is $40 and Meta reports $55, the campaign is losing money regardless of how good the CTR looks upstream.
CVR (conversions divided by clicks) and AOV (revenue divided by orders) both feed cost per result. A CTR win that doesn't move cost per result usually means the page, not the ad, is the leak, part of why your CAC is so high.
Is my Facebook ROAS even real, or is MER the truer number?
ROAS is attributed revenue divided by ad spend, modeled by whichever platform reports it. It reflects that platform's own attribution logic, not your bank account.
MER is different: total revenue divided by total ad spend, pulled from your own ledger across every channel. The same sale can be claimed by Facebook, Google, and email at once, so summed ROAS across platforms can overstate the true lift. MER cannot be inflated that way, since it only counts revenue once.
A "good" ROAS or MER is not a fixed number; it depends on your margin, your AOV, and your model. Benchmark against your own break-even, not a number in a Facebook group. The deeper read is what is MER vs ROAS and is my Facebook ROAS even real.
Why are my Facebook CPMs so high right now?
Picture the auction as a live room full of advertisers bidding for the same slice of attention. CPM is the byproduct of that auction. Meta's documentation confirms it weighs your bid, the estimated action rate, and ad quality together, so the highest bid alone doesn't automatically win.
The drivers behind a rising CPM: more advertisers competing for that audience, seasonal demand (Q4, holidays, elections), how narrow the audience is, ad relevance, and placement. The full read is why are my Facebook CPMs so high.
What CPM doesn't tell you is whether the ad is working. Specific "normal" CPM dollar figures circulating online are third-party estimates and vary too much by account, season, and niche to state as fact.
What's the triage order when cost per result rises?
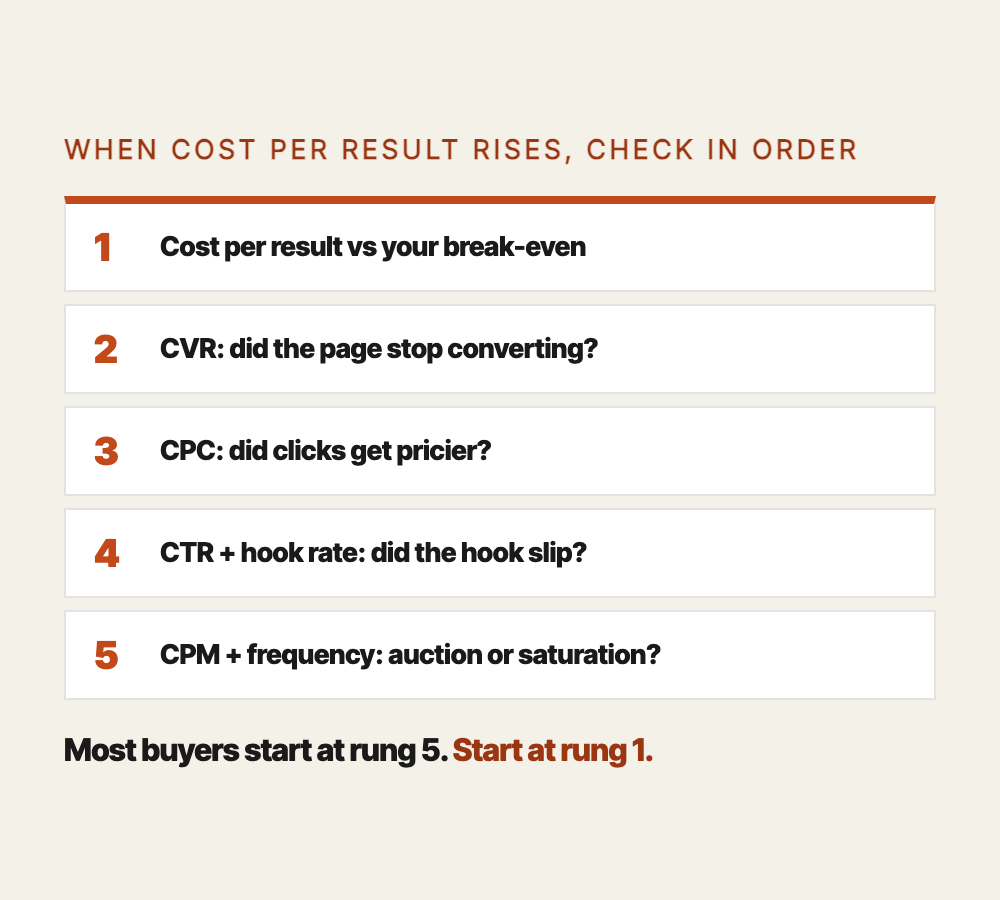
Give the check a name so you can retrieve it under pressure instead of re-deriving it. Call it the diagnostic ladder, and work it top to bottom.
First, confirm cost per result actually rose, using your own break-even as the yardstick. Second, check CVR, did the destination stop converting. Third, check CPC, did clicks get more expensive. Fourth, check CTR and hook rate together, did the hook stop earning attention. Fifth, check CPM and frequency last, is the audience saturated or the auction more competitive.
This order matters because most media buyers start at the bottom (CPM) and work up, so they're often "fixing" a CPM that was never the actual problem.
Frequently asked questions
What is MER vs ROAS?
MER is total revenue divided by total ad spend, pulled from your own ledger across every channel. ROAS is attributed revenue divided by spend, reported per platform using that platform's own attribution model. MER cannot be inflated by double-counting one sale across two platforms; summed ROAS can.
Is my Facebook ROAS even real?
It's real in the sense that Meta calculated it by its own attribution rules, but it's not your bank account. If the same purchase gets credited by Facebook, Google, and email at once, adding up each platform's ROAS overstates your actual return. Check MER against your bank deposits to know the true number.
Why are my Facebook CPMs so high?
CPM rises because of auction competition, seasonality, audience size and specificity, ad relevance and quality signals, and placement. It's not a fixed price Meta charges you, it's the output of a live auction every time an impression is served.
Why is my CAC so high?
Cost per result rises for reasons found by working the diagnostic ladder: a page not converting, clicks that got more expensive, a hook that stopped earning attention, or an auction that got more competitive. Check in that order, from closest to the sale outward to CPM, rather than assuming CPM is the culprit first.
Are hook rate and hold rate official Facebook metrics?
No. Hook rate (3-second video views divided by impressions) and hold rate are practitioner ratios built on Meta's raw video-view columns. ThruPlay, a video played to completion or watched 15 seconds or more, is an official Meta metric. Hook rate and hold rate are not, and different tools calculate them differently, so there is no canonical benchmark for either.
Related reading: what is MER vs ROAS and why are my CPMs so high. For the framework this sits inside, see the Realignment Protocol.